
SIEM Home Lab Series (Part 1)
Thumbnail image "Computer Data Output" by JoshuaDavisPhotography is licensed under CC BY-SA 2.0
This is the first of a multi-part series on building a SIEM lab and training with ‘Purple Team’ skills. I say ‘Purple’ because while the emphasis will be on ‘Blue Team’ activities we will also need to use ‘Red Team’ techniques to populate our SIEM with relevant data. The series will be broken out into the following parts:
Building the lab
For those who want to follow along I am going to make a bunch of assumptions about your skills and technical expertise - namely that you have a basic understanding of IT fundamentals and that you know what a SIEM is.
Side note:
Most of the setup in these guides will be manual but there are alternative (and better) ways to build all this stuff using automation. DevOps tools such as Vagrant and Ansible are great for this kind of work and while I do have some experience with these tools I do not currently have a fully functional, end-to-end setup in place - that will have to wait for a future blog post :)
SIEM Options
There are a bunch of popular (and expensive) SIEMs on the market such as Splunk and LogRhythm that are meant for enterprise environments but my use case is for a small home lab and I don’t have the hardware (or the $$$) for an elaborate enterprise application.
While Splunk at least does have a free version, and is one of the most well-known SIEM products on the market, I decided to use an alternative option called Elastic that is free, opensource, and light enough to squeeze into my home lab. Due to it’s opensource license Elastic is very widely used and forms the core of several other SIEM applications that I’ll briefly reference below.
Elastic
https://www.elastic.co/elastic-stack
Originally a single application called ‘Elasticsearch’ that eventually incorporated complimentary apps (Logstash and Kibana) to form the ‘ELK Stack’. Over time more functionality and app integrations have been added to ELK beyond the three primary apps so now even Elastic developers just refer to it as the ‘Elastic Stack’.
Graylog
https://www.graylog.org/products/open-source
Uses Elasticsearch and MongoDB as it’s core but also includes a nice web GUI.
SOF-ELK
A heavily customized version of the Elastic Stack that is developed by SANS and is used in their ‘Tactical SIEM’ course.
HELK
https://github.com/Cyb3rWard0g/HELK
Another heavily customized version of the Elastic Stack that focuses on threat hunting.
All of these options are great, and some are better at certain things than others, but for my use case I decided to go with a pure Elastic stack due to it’s simplicity and light footprint.
It looks nice too :)
Lab Overview
As I said before, I don’t have a lot of computing horsepower to build a large test environment so our lab is going to be quite modest. Despite the limitations we will still have the core elements in place to mimic a traditional on-prem enterprise network and we can always add additional systems later.
Lab Specs and Notes
My host PC has the following specs:
Windows 10
Intel i5 Skylake CPU, super old (>.<)
16 GB RAM
1 TB SSD
Each virtual machine has the following specs:
Active Directory - Windows Server 2019 (1 CPU, 2 GB RAM)
Elastic SIEM - Ubuntu Server 20.04 LTS (2 CPUs, 2 GB RAM)
Workstation 1 - Windows 10 (1 CPU, 2 GB RAM)
Workstation 2 (optional) - Windows 10 (1 CPU, 2 GB RAM)
Attacker Workstation (optional) - Kali Linux (Gnome DE) (2 CPUs, 4 GB RAM)
If you need some guidance on how to set up an Active Directory server and a domain-joined Windows 10 workstation please see the video below:
Alternatively, you can reference this guide.
Miscellaneous notes:
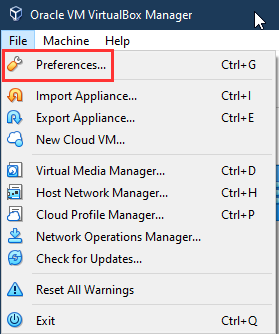
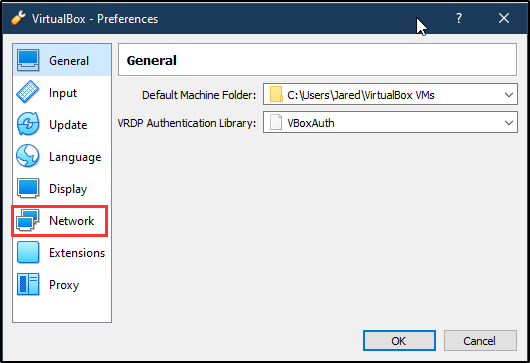
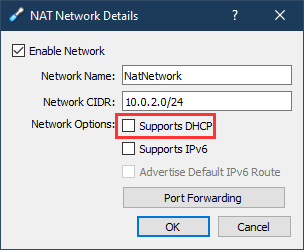
I am using Virtualbox for my hypervisor because it’s free and fully featured. Alternatively you can use the free version of VMware (though it lacks features such as the ability to take guest snapshots)
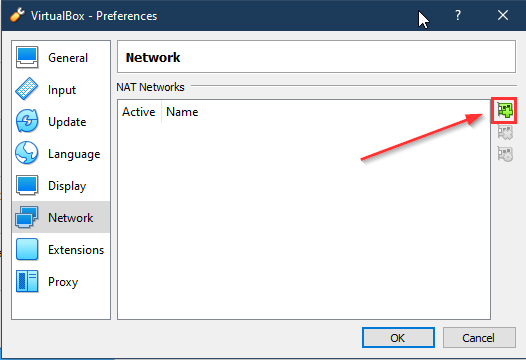
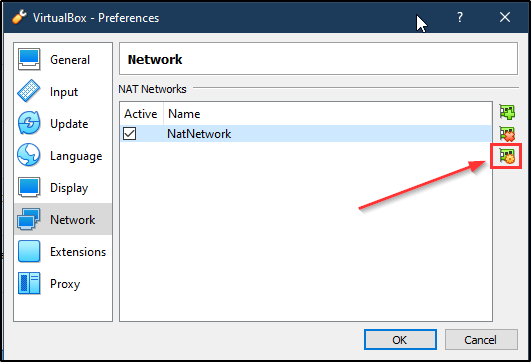
I use the Nat Network type and rely on the domain controller for client DHCP (see below for screenshots of the Virtualbox configuration)
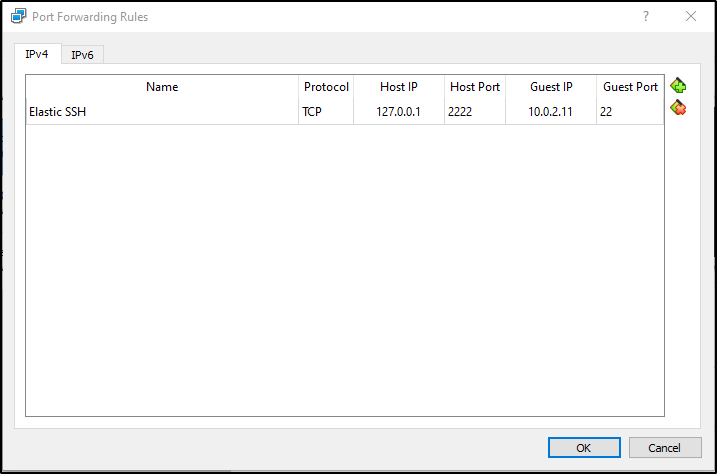
I also use port forwarding to connect to and manage the Elastic server (see the ‘Installing Elastic’ section further down)
Elastic Overview
A fully decked out Elastic Stack has many different components and integrations but we are going to focus on just two of the primary applications - Elasticsearch and Kibana. In a production environment these apps would each be installed separately but due to home lab constraints we are going to smoosh them into one server.
This is a simplified example of how a typical production implementation will look…
…versus how it looks in our lab.
I used Ubuntu to host the Elastic Stack but you can use a different OS such as Debian, OpenSUSE, or even Windows if you want. If you need guidance on how to set up an Ubuntu server in Virtualbox please see this walkthrough - otherwise DuckDuckGo is your friend.
Once you have your server set up it’s easy to install Elastic since the documentation is actually pretty good compared to a lot of opensource products. The process basically boils down to:
Importing Elastic’s PGP key
(optional) Install the apt-transport-https package to keep others from snooping on your traffic to the repos
Add Elastic to the local sources list
Install the app(s) via the local package manager
Edit some config files
Before we get too deep into the weeds let’s quickly go over the components we are going to be installing on our server.
Elasticsearch
“Elasticsearch provides near real-time search and analytics for all types of data. Whether you have structured or unstructured text, numerical data, or geospatial data, Elasticsearch can efficiently store and index it in a way that supports fast searches.”
Kibana
An open-source analytics and visualization platform. Use Kibana to explore your Elasticsearch data, and then build beautiful visualizations and dashboards.
A UI for managing the Elastic Stack. Manage your security settings, assign user roles, take snapshots, roll up your data, and more — all from the convenience of a Kibana UI.
A centralized hub for Elastic’s solutions. From log analytics to document discovery to SIEM, Kibana is the portal for accessing these and other capabilities.
Most people reading this are probably too young to remember these…
A rough analogy would be to compare Elastic to one of those old View-Master stereoscope toys from back in the day. Imagine Elasticsearch data are the reels of photos and Kibana is the viewer that allows you to look at the photos and quickly flip through them on the fly.
Installing Elastic
Now that all the groundwork has been laid we can get to the fun part and install Elastic. I’m starting with a fresh install of Ubuntu server that has been updated and is ready to go.
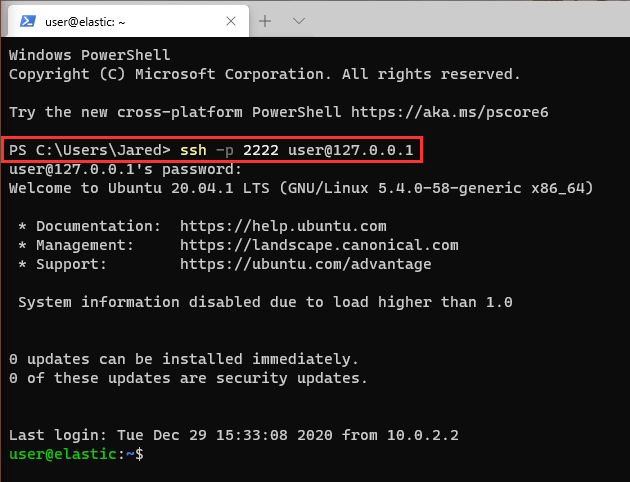
Before starting the installation process I set up port forwarding on my NatNetwork so I could use the Windows Terminal app on my host PC to interact with my Elastic server. You don’t really need to do this but I find it a more comfortable terminal to work in.
We start by adding Elastic’s PGP signing key to our APT keyring:
wget -qO - https://artifacts.elastic.co/GPG-KEY-elasticsearch | sudo apt-key add -The next (optional) step is to install the apt-transport-https package in order to secure traffic between your system and the public repos:
sudo apt-get install apt-transport-httpsNow we add Elastic to our source list:
echo "deb https://artifacts.elastic.co/packages/7.x/apt stable main" | sudo tee /etc/apt/sources.list.d/elastic-7.x.listAnd finally install both Elasticsearch and Kibana:
sudo apt-get update && sudo apt-get install elasticsearch kibanaAnother optional step is to configure systemd to automatically start Elasticsearch and Kibana after system boot-up:
sudo /bin/systemctl daemon-reloadsudo /bin/systemctl enable elasticsearch.servicesudo /bin/systemctl daemon-reloadsudo /bin/systemctl enable kibana.serviceAnd that’s it, Elastic is now installed on our server.
See below for the configuration steps necessary to get our new SIEM up and running.
Configuring Elastic
Before continuing we need to establish something up front regarding our ‘home lab’ version of Elastic - namely that it is crazy insecure. To make things simple and easy we are going to forgo things like certificates and unique passwords that would normally be essential in a production environment.
DO NOT REPLICATE THIS CONFIGURATION IN A PRODUCTION ENVIRONMENT!
Ye be warned.
Elastic configuration files are in YAML format and are relatively easy to work with.
Elasticsearch
Using the editor of your choice open /etc/elasticsearch/elasticsearch.yml and look for the ‘Network’ section.
Uncomment the line for network.host and replace it with the IP address that you assigned to the local server.
Uncomment the line for http.port but leave it with the value ‘9200’
Next, find the section called ‘Discovery’ and add a new line with the following:
discovery.type: single-nodeNormally you would not have just one Elasticsearch server but several that are joined together in a cluster. By configuring the discovery type as ‘single-node’ we are telling Elasticsearch not to try and find any other neighbor nodes. Also, this setting automatically bypasses several strict bootstrap checks that you would want to maintain in a highly available production cluster; we are not concerned with such things in our home lab so it’s not a concern.
When you are done go ahead and save your changes, restart the elasticsearch service, and verify that it is running:
Kibana
Open the file /etc/kibana/kibana.yml:
Uncomment the line for server.port but leave the value of ‘5601’
Uncomment the line for server.host and replace ‘localhost’ with the IP address of the server
Uncomment the line elasticsearch.hosts and replace ‘localhost’ with the IP address of the server
Save your changes, restart the Kibana service, and verify that it is running
The Kibana web portal should now be available. You can access it either via a browser on one of the virtual guests within the NatNetwork or the browser on your local host PC (make sure to first set up another port forwarding rule in Virtualbox)
Technically we now have a functioning Elastic Stack set up and running. As I said before, Elastic has all kinds of functionality, integrations, and features for any number of use cases but I am not going go over all that here.
For the purposes of our home lab we want to look at the ‘Security’ section of the Kibana dashboard:
As you click around you will find that most everything is accessible but certain parts of the Elastic Stack require additional configuration.
Additional Configuration
We will need to go back to both the Elasticsearch and Kibana config files and make some more changes in order to access everything Elastic has to offer.
Back in the /etc/elasticsearch/elasticsearch.yml file scroll to the bottom and in the ‘Various’ section start a new line and add the following:
xpack.security.enabled: truexpack.security.authc.api_key.enabled: true#xpack: security: authc: realms: native: native1: order: 0What we are doing is enabling X-Pack which is an optional extension that provides several different features.
One of those features is what Elastic calls Realms and to us means an authentication scheme; we are using the Native realm which is basically local authentication. Other types of realms such as SAML authentication require paid licensing to use.
Save your changes to the config file and restart Elasticsearch.
Next, move into the /usr/share/elasticsearch/bin folder. The Elastic Stack has a bunch of built-in user accounts and we need to setup their passwords by typing:
sudo ./elasticsearch-setup-passwords interactiveThis kicks off an interactive script that will ask you to input a password for each built-in user. I simply used ‘Password123’ for all of them but you can use whatever you want. Again, it bears repeating that this makes things easier in our home lab but you should always use unique passwords for accounts in a production environment!
Restart Elasticsearch once more.
The next step is to go back into the /etc/kibana/kibana.yml file and make some changes there as well.
Scroll down until you see the section that references the elasticsearch.username and elasticsearch.password - uncomment those lines and make sure to replace the password value with whatever you set up previously.
Finally, scroll to the bottom and add the following lines:
xpack.security.enabled: truexpack.ingestManager.fleet.tlsCheckDisabled: truexpack.encryptedSavedObjects.encryptionKey: "aaaaaaaaaaaaaaaaaaaaaaaaaaaaaaaa"The first line enables the X-Pack extension for Kibana and the last two lines enable functionality for the Fleet beta that we will use in part 2 of this series.
Restart Kibana and then refresh your browser tab - you should now be presented with a login prompt.
The username will be ‘elastic’ and the password will be whatever you set previously for that account.
After successfully logging in you will find that you can now access the parts of Kibana that you could not before:
And that wraps it up for now.
Feel free to poke around and explore the Kibana UI. Admittedly there won’t be much to look at until you start ingesting logs but I am saving that for the next post. We will go over how to configure a Windows environment to generate the right kinds of logs/events as well as how to ingest them into Elastic using Beats and the new Elastic Agent.